Financial Fair Play - The Championship Model

Before I publish part 3 of my Championship Finances Review I want to outline Financial Fair Play in the Championship. The purpose of Financial Fair Play, how it is implemented, how it affects each club in the league, and how you should interpret your club's figures.

Financial Fair Play (FFP from hereon) is a set of regulations, negotiated between the Football League and its clubs, that attempts to establish a league of financially sustainable and responsible football clubs.

Each division in the Football League has its own set of regulations which differ slightly, but I will be focussing on the Championship as this is the league I have been covering in previous posts.

Acceptable Losses & Shareholder Equity

The clubs in the Championship must abide by the UEFA FFP model which requires clubs to at least break even, with operating losses only being acceptable within defined limits during the 'adjustment period'.

Shareholder influence will also reduced over time in order to stop a club being solely reliant on funding from ownership (known as shareholder equity).

Clubs will be required to provide The Football League with detailed financial accounts before December 1 of every year, which will then be assessed by the league and a 'Fair Play Table' will be released that ranks every club.

The Football League will assign each team a “Fair Play Result” which is based upon their financial performance. There are two tiers of the “Fair Play Result”.

1. A club that is break even or profitable (excluding external investment from ownership) will be given a positive value that is equal to the club's profit for the previous financial year. The league has outlined a plan to exclude certain items when calculating a club's P&L, such as infrastructure investment, but I will cover this later.

2. A club may be loss-making provided it is within an acceptable deviation and must be covered by shareholder equity. The permitted level of acceptable deviation or the amount of shareholder equity allowed will be reduced over time – the overall aim of this “adjustment period” is to remove the reliance and influence of ownership funds and force clubs to be sustainable as an independent entity.
Season
Acceptable Loss Deviation Permitted (£m)
Shareholder Equity Permitted
(£m)
Total Permitted Allowances
(£m)
2011/12
4
8
12
2012/13
4
6
10
2013/14
3
5
8
2014/15
3
3
6
2015/16 +
2
3
5
Spending Allowances

Whilst calculating a club's annual profit or loss, which in turn determines their 'fair play result', the Football League have outlined a few exceptions that will be made.

1. Investment in Youth Development or Infrastructure (including charitable or community expenses) which are deemed beneficial to the club or league will not be taken in to account when calculating their P&L.

2. The profit affecting element of the purchase, sale and depreciation of fixed assets excluding players (e.g. a club's stadium).

Sanctions

The financial performance of clubs in the 2011/12 and 2012/13 seasons will be monitored, but no sanctions will be put in place.

Going forward, any club that remains in the Championship that does not meet the regulations set out in FFP, will be subject to a transfer embargo, starting with the 2015 January transfer window. The club will not be permitted to make any signings (including free players) until they lodge information with the Football League that clearly shows they are falling in line.

Fair Play Tax - Promotion

If a club is promoted to the Premier League and it is later deemed that they have done so whilst not following the FFP regulations, will be subject to a fair play tax.

Clubs that are relegated from the Premier League will not be forced to abide by FFP regulations in their first year. This season of unregulation is strictly limited to one year.

If the club is immediately promoted back to the Premier League then they will be subject to a 'fair play tax' which is determined by the extent to which they deviated from FFP, and applied at the following thresholds:
Deviation from FFP
Fair Play Tax
£1 - £100,000
1%
£100,001 - £500,000
20%
£500,001 - £1,000,000
40%
£1,000,001 - £5,000,000
60%
£5,000,001 - £10,000,000
80%
£10,000,001 +
100%
Funds raised through the Fair Play Tax will be distributed amongst the clubs that have conformed to FFP.

Salary Cost Management Protocol (SCMP)

The Championship and the Football League have decided not to limit expenditure on player's salaries, whereas League 1 and 2 have defined spending limits which are directly linked to a club's total turnover.

By not agreeing a SCMP, it is at the discretion of each club to decide how much they want to spend on players salaries, but in deciding this amount, they must abide by the overall FFP model.

For sake of comparison, going forward from this season, League 1 clubs must not spend more than 60% of their total turnover on players salaries.

Points for discussion

1. A club may chose to ignore FFP regulations provided they are willing to gamble on immediate promotion and are happy to pay the fair play tax.

2. A club relegated from the Premier League will have an obvious advantage in the Championship as they are not required to abide by FFP in the first year.

3. If a club is promoted and has ignored FFP, surely stepping in and stopping them from being promoted would be a better disincentive? This might not be possible because they only have to submit their accounts by December 1 so the Premier League season would have already started.

4. A transfer embargo may actually worsen a club's financial position if their losses are not related to their spending on players but actually due to another factor.

I hope the above clears things up for you and puts you in a good situation to understand how FFP will affect your club. Make sure you stick around for "Part 3 - Profit & Loss" of my Championship Review.


Also - follow me on Twitter for first access to my articles.

Over & out,

JW

Championship Finances - Part 2: Expenditure

Apologies for the slight delay getting this post online - I've recently changed jobs so had a little less time to get this complete. If you haven't read Part 1 then I advise you do so before going any further.

But as promised, here is Part 2 of my review of the Championship Finances focussing on club expenditure.


West Ham were the league's highest spenders splashing out just shy of £55m in total. Barnsley, who just avoided relegation, were the only club to spend less than £10m in total, an impressive feat if you consider they were playing against teams who were willing to spend far more on their playing squad.

Total league expenditure rose above half a billion for the first time, but only £4m was paid by clubs in direct taxation. In fact, Middlesbrough received a tidy £3m tax rebate for readjusting their previous financial disclosures.

As you all know, a high proportion of a club's costs are incurred through player salaries and as teams chase that golden promotion to the EPL (and the financial windfall that comes with it) they have been happy to break the bank to bring in better players.


9 clubs in the Championship were happy to pay more in player salaries than the amount the club actually generates, a worrying figure to say the least. Bristol City, who have a limited ability to generate revenue because of the size of their Ashton Gate ground (avg home attendance 13,836), spent £18.7m in player salaries but only generated a total turnover of £11.9m.

Unsurprisingly, the league's biggest spenders were West Ham at £41.6m, with second place going to Southampton who paid out £28.7m.

Reading spent 135% of their revenue (£19.9m) on players (£26.8m) but this gamble obviously paid off as they stormed to the Championship title and got their golden EPL pay day.

The league average was 93% which is far too high to be sustainable.


I included this graph in a separate post the other day as I think it throws up an interesting concept: effective player cost per league point achieved.

In essence what it tells you is this: how much (£,000s) the club paid in player salaries to achieve one Championship point. For example, eventual winners Reading accumulated 89 points by spending £26.8m in player salaries, an effective cost of £301,000 per point.

Peterborough Utd, who were promoted the season before and eventually finished 18th, had the lowest effective cost at £114,000. They paid out just £5.7m in player salaries and finished one spot ahead of Nottm Forest who had spent £17.4m in salaries.

Again, West Ham led the way on this measure, partly because they retained their core Premier League squad in the hope of returning to the EPL at the first attempt (they did through the play-offs). With a total wage bill of £41.6m, they effectively paid £484,000 per point.

Although they failed to return to the EPL, I think Blackpool were the stand out performers when you consider this measure. With an effective cost of £165,000, they were the only team to make the play-offs with a sub-£200k figure.

Total net debt across the league rose to £830m, with Brighton leading the way with net debts totalling £110m partly due to their recent investment in building the new Amex Stadium. The majority of this debt is owed to Brighton owner, Tony Bloom, who has bankrolled the club's recent rise through the league.

Although the graph does show that the majority of clubs in the league owe a substantial amount of money, these figures are likely to fall drastically in the upcoming years with the introduction of Financial Fair Play regulations. I am going to look at FFP in Part 3 when I look at the Profit and Loss Accounts for each club, but the majority of the debts owed across the league are directorship loans which will (probably) be converted into equity in order to bring clubs in line with the new regulations.


The above table shows the net debt to revenue ratio for each club in the league. For those who don't know, a number above 1 says that the club has net debts greater than their annual turnover. For example, Ipswich Town are holding net debts totalling £72.5m but the club only generated £15m in turnover that year, hence their net debt to revenue ratio of 4.8.

Only 8 clubs in the league have a ratio less than 1 (so they owe less than the amount they generate each year) with Leeds leading the way with a ratio value of 0.05 because they only hold a negligible amount of debt.

That pretty much concludes Part 2 of my review of expenditure. I've had a few people ask why I've split my review into three separate articles, so I think it's important to say why here.

In my writing I always try to explain figures and ratios using the simplest explanation or the most suitable graph. In doing so, I feel like I am able to target a greater number of football fans and therefore those who don't have a financial background are still able to understand their club's position. As a result I decided to split the core business of a football club into three simple functions - 1) Revenue 2) Expenditure 3) Operating Profits.

Hope you stick around for Part 3 as this is where the nitty and gritty analysis will be done when I look at Operating Profits (well, pretty much Operating Losses) across the league.

Premier League - Data is Beautiful

Quick post again but this is well worth it.

Below is an infographic from the guys over at MatchStory which shows the fixtures and difficulty ranking for every EPL 2013/14 match.

It's a great example of how to incorporate a lot of data into a simple visual aid.


Observations:
  • Both Manchester derby matches are scheduled immediately after potential Champions League fixtures (matches 5 and 28), which could lead to some selection dilemmas as they attempt to compete on both fronts.
  • Villa have a pretty horrible start, without a relatively ‘easy’ game until October, so don’t be surprised if they spend the early part of the season near the foot of the table. February and April provide opportunities for a late surge up the table, although a stressful March could disrupt their momentum.
  • January is a significant month for two of the three newly-promoted clubs which could well shape their respective destinies. Cardiff’s is truly horrendous with away trips to 3 of last season’s top 4, while Crystal Palace enjoy 3 of their more winnable home games.
  • Sunderland and West Brom could benefit from having all four of their hardest games scheduled before or after Champions League ties which could distract their opposition. Both have away games against one of the big four either side of the semi finals (matches 35 and 37).
  • After a potentially lousy run of games at the back end of March which may cause Arsenal to stutter, the Gunners have a relatively easy finish to their campaign which could see them finish strongly.

Also if you click on the image you will be redirected to their website which also presents an interactive version that displays betting odds for every fixture.

Over & out,

- JW

Championship - Effective player cost per league point

In preparation for 'Part 2 - Club Expenditure" of my Championship Review I have decided to show you one of the graphs that I have created that I find a little interesting.

As an economist, I tend to focus on the small details and we use a lot of measures such as 'marginal cost' to analyse a company or something. This frame of mind got me thinking about the following -

"How much does a club effectively pay to accumulate one league point?"

I'm also quite a fan of the NFL and one of the things that I have took away from American Football is their constant focus on player performance and all of the measures they have created in order to analyse how successful a player, or a team, is during a season.

So what I've done is created a measure, "effective player cost per league point" which indicates the club's player wage bill as a ratio to the points they managed to accumulate that season. For example, my measure shows it cost Derby County £203,000 a year in player wages to get one point in the Championship 11/12.

So here's the graph, and I'll add the league table with the raw data just below.


It's a shame that the wage bill data for Pompey and Coventry isn't available but I still think there's a few things to point out. 

Firstly, Blackpool's effective wage cost per league point of £165,000 is the stand out figure. Doncaster, who were relegated with just 36 points, had an effective wage cost of £261,000. Birmingham City spent over twice as much on player salaries and managed to accumulate just one more point. Think it shows just how well Blackpool did to make it into the play-offs.

West Ham, who were relegated the season before but managed to make it back to the EPL through the play-offs, had both the highest annual wage bill (£41.6m) and highest effective cost per league point (£484,000).

At the moment I'm not too sure how much focus to give the measure, but it's certainly interesting. Would love to hear your comments in the box below.

-- Jack

Championship Finances - Part 1: Revenue

As Part 1 of my review I will be focusing on revenue, both at the aggregate level and on a club-by-club basis. Part 2 will provide a review of club expenditures and costs, and Part 3 will focus on the profitability and viability of Championship clubs going forward (including a look at where each club stands in terms of FFP).

The figures that I use have been obtained from the clubs financial disclosures but I have had to make a few financial adjustments in order to standardise the figures / categories.

Firstly, for the 2011/12 season, total league revenue has increased to £467m – an impressive increase of 13% on the previous season. West Ham Utd generated the greatest revenue at £46m (helped in part by the receipt of parachute payments) with Birmingham City finishing a distant second at £39m.

The three clubs that won promotion to the EPL (Reading, Southampton and West Ham) generated an average of £29.6m each – well above the league average of £19.5m.

Doncaster Rovers, who finished bottom of the league and were relegated with just 36 points from their 46 matches, only generated £8.2m from all of their activities as a football club. In comparison, the ambitious Brighton & Hove Albion generated 8.6m in commercial revenues after moving into their new £90m Amex Stadium.


The ”Other” category is only applicable to Reading who generated a tidy £5.2m through their Madejski Stadium hotel operation.

Clubs that are relegated from the Premier League receive a form of compensation, known as the parachute payment, that aims to allow clubs to absorb the resultant revenue losses. At present, clubs receive £48m over four years (Year 1 – £15m, Year 2 – £17m, then £8m the next two seasons).

For the 2011/12 season, the average revenue for the seven clubs in receipt of parachute payments (West Ham, Birmingham City, Blackpool, Hull City, Burnley, Middlesbrough & Portsmouth) was £29m, with the other seventeen clubs generating an average of just £16m.

Although many have criticised the practice of compensating clubs who are relegated from the EPL (former Barnsley manager Keith Hill called it “rewarding failure”), from the 2013/14 season, parachute payments are set to increase to around £59m, albeit with a slightly changed payment structure.

The FA and Richard Scudamore have refused to budge on their proposals for higher parachute payments. The argument against the payments, that they effectively create a 'Premier League 2' within the Championship, is well founded when we look at the revenue differentials between Championship clubs.


Each club not in receipt of any parachute payment receives an annual fixed sum of £2.3m for participating in the Championship, known as the 'Solidarity Payment'.

It is unlikely that the Championship clubs will be able to renegotiate any deal with the Premier League which would allow a more equitable distribution of Premier League TV rights. Parachute Payments are governed by a formula contained within the 'Founder Members Agreement' and are directly related to the amount that the Premier League generates through TV rights, whereas Solidarity Payments (which were negotiated in separate talks) aim to develop youth and community projects in teams outside the EPL.

However, it is only fair to point out that since the 2009/10 season, only two of the nine clubs that have been relegated from the EPL, and have benefited from the parachute payments, have subsequently won promotion back to the top tier.

The average attendance of a Championship match was 17,496, representing a 65% utilisation of total capacity. In comparison, for the same year, Premier League fixtures had a 95% utilisation.

West Ham, despite playing in the second tier of English Football, boasted an impressive 88% utilisation of Upton Park on match days. At the other end of the spectrum, Barnsley (45%) typically failed to fill up half of their stadium.

Only three clubs (West Ham, Southampton and Leeds Utd) generated over £10m in ticketing and match day revenues. Doncaster Rovers and Barnsley struggled to pass the £2m mark.

Total commercial revenue (shirt sales, memorabilia etc) across the league increased slightly to £115m, with the more traditional clubs generating substantially more than others. West Ham managed their commercial activities pretty well considering their previous relegation, with their retail and commercial operation only experiencing a £3.5m drop in revenue.


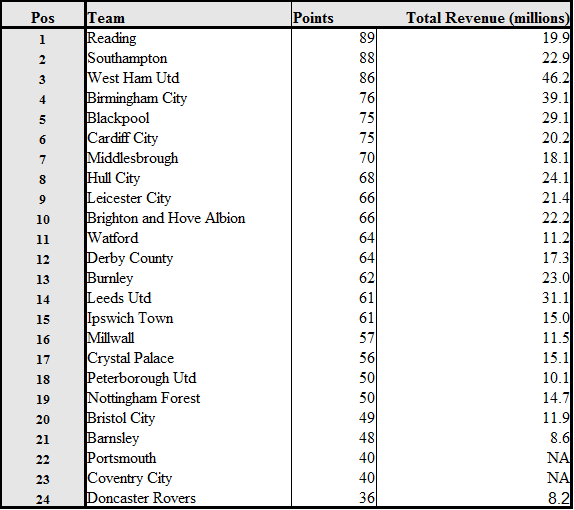
Although it doesn't add much in terms of a visual aid, I thought I'd include the final league table alongside the respective revenue figures.


The top six clubs (those who were automatically promoted or made it to the play-offs) generated 40% of the total league revenue (excluding Portsmouth and Coventry City who haven't released their financial statements due to the ongoing financial problems they are experiencing) - a significant proportion of the total league revenue and obviously a key factor in making the final push for the Premier League.

Stay tuned for Part 2 of my review of the Championship finances where I will be focussing on club costs and expenditures (including the much debated wage cap). 

Make sure you follow @Chairmansnote on Twitter for first access to articles and updates.

Financial Fair Play - Brighton will struggle to fall in line

In April 2012, Championship clubs voted to introduce Financial Fair Play regulations that will regulate all clubs from the 2014/15 season. The purpose of the new regulations is to curb total spending and prevent owners from funding football clubs through directorship loans.

Brighton & Hove Albion, now competing in the Championship and who finished 4th last season narrowly missing out on promotion on the Premier League, are one of the few Championship clubs who will struggle to fall in line with the new FFP regulations.

The FFP regulations stipulate a number of restrictions on clubs but mainly target the bottom-line figure. Starting this season, clubs losing more than £8 million will be subject to sanctions. This figure will reduce to £5 million next year, effectively giving clubs an 'adjustment' period in which they must consolidate their spending.


Upon inspection of their accounts, over the last 4 years, Brighton have accrued staggering losses of £24,934,031 - a huge figure no matter the size of the club. Despite their Chief Executive Paul Barber's ambition to "build and build", the management will need to clamp down, and quick.

In recent years, Brighton have heavily relied upon their owner, Tony Bloom, to fund their activities. According to their latest accounts the club owe him £120m, with £40m already converted in to share capital raising his ownership to 91%. It is crystal clear that Bloom continues to support the club's losses, exactly what the FFP regulations are trying to stop.

The majority of Bloom's investment has been used to fund the development of the club's new stadium, the Amex. Ticket revenues have soared from £2.3m to £7.9m after the club sold 22,000 season tickets and retail & media has jumped to £2.6m (mainly thanks to selling the naming rights to American Express). In 2011-12, Brighton had the 5th highest match day revenue at £7.3m - only West Ham, Soton, Leeds and Birmingham beat them.

In the 2012 statements, it is noted by the auditors that the club rely on his "ability to generate further funding" and highlight the club's liabilities are currently exceeding its assets by £13.3m.

Despite their worrying losses, the general consensus around the club is positive. It appears that fans are happy to ignore the financial state of the club and only focus on team's league performance. Admittedly I am a little shocked by the Official Supporters Club's opinion on the whole issue. Stefan Swift, editor of the fanzine 'The Seagul Review", was quoted as saying "the stadium is so good and the fans have never had it this good"

Going forward, the success of the team will be relient upon the board's control of costs. Assuming they want to attract players which will allow them to challenge for the EPL (meaning their wage bill will remain at the current level ~ £13.2m) then they will need to employ some major cost cutting measures.

It is only fair to highlight that, being the year they finally moved into their Amex Stadium, the club have incured exceptional costs of £9.4m (£7.5m in 2011 to £16.9m) credited to the cost of furnishing their new digs. If I were to set this to one side then the club would have been in the black, just.

The benefactor model (where a club is substantially financed through a director) is being stamped out by league. Brighton are going to be hit hard and will need to seek & generate new sources of revenues, and cut costs substantially.